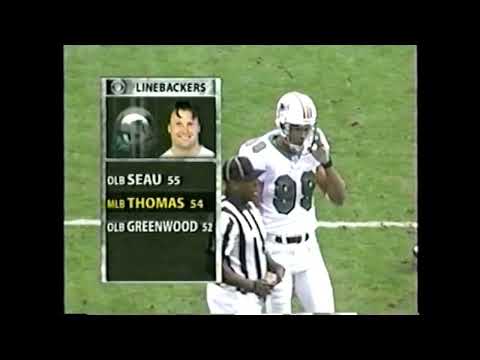
¿Qué significa cada estadística? Consulta la guía de estadísticas.
- Semana: 17
- Fecha: 28 de diciembre de 2003
- Estadio: Pro Player Stadium
- Tipo de estadio: Al aire libre
- Superficie de juego: Césped
- Clima: 73 grados, humedad relativa 63%, viento 10 mph, viento chill 0
Videos del partido
Anotaciones
| Equipo | 1 | 2 | 3 | 4 | Final |
|---|
| New York Jets | 0 | 10 | 5 | 6 | 21 |
| Miami Dolphins | 3 | 17 | 0 | 3 | 23 |
Olindo Mare field goal de 23 yardas
Olindo Mare field goal de 43 yardas
Ricky Williams carrera de 16 yardas (Olindo Mare kick)
Curtis Martin carrera de 8 yardas (Doug Brien kick)
Chris Chambers pase de 20 yardas de Jay Fiedler (Olindo Mare kick)
Doug Brien field goal de 36 yardas
Doug Brien field goal de 22 yardas
Safety,
Anthony Becht pase de 1 yarda de Chad Pennington (conversión fallida)
Olindo Mare field goal de 22 yardas
Equipos
New York Jets
Coach: Herm Edwards |
Puntos: 21 |
Record: 6-10
Estadísticas del equipo
| Balones sueltos y pérdidas | 0-0 |
|---|
| Balones sueltos-perdidos | 0-0 |
|---|
| Carreras-yardas-TD | 25-94-1 |
|---|
| Comp-Int-Yds-TD-INT | 22-28-221-1-0 |
|---|
| Conv. en cuarto down | 0-0 |
|---|
| Conv. en tercer down | 7-13 |
|---|
| Despejes: número y promedio | 4-38.8 |
|---|
| Eficacia en cuarto down | 0-0-0% |
|---|
| Eficacia en situación goal-to-go | 2-3-67% |
|---|
| Eficacia en tercer down | 7-13-54% |
|---|
| Eficacia en zona roja | 2-4-50% |
|---|
| FG y puntos extra bloqueados | 0-0 |
|---|
| Goles de campo anotados-intentados | 2-2 |
|---|
| Jugadas de carrera totales | 25 |
|---|
| Jugadas ofensivas totales (incluye sacks) | 57 |
|---|
| Pases intentados-completados-interceptados | 28-22-0 |
|---|
| Passing Made-Attempts | 0-1 |
|---|
| Patadas anotadas-intentadas | 1-1 |
|---|
| Penalizaciones-yardas | 4-40 |
|---|
| Penalizaciones: número y yardas | 4-40 |
|---|
| Placajes detrás de la línea: número y yardas | 3-7 |
|---|
| Por pase | 14 |
|---|
| Primeros downs | 19 |
|---|
| Primeros downs totales | 19 |
|---|
| Promedio neto de despeje | 38.8 |
|---|
| Promedio por carrera | 3.8 |
|---|
| Promedio por jugada de pase (incluye sacks) | 6.0 |
|---|
| Promedio por jugada ofensiva | 5.0 |
|---|
| Puntos extra anotados-intentados | 1-2 |
|---|
| Pérdidas de balón | 0 |
|---|
| Resultado final | 21 |
|---|
| Retornos de despeje: número y yardas | 0-0 |
|---|
| Retornos de intercepción: número y yardas | 1-26 |
|---|
| Retornos de kickoff: número y yardas | 4-56 |
|---|
| Sacks recibidos-yardas perdidas al pasar | 4-30 |
|---|
| Sacks-yardas perdidas | 4-30 |
|---|
| Saques de salida: total-en zona de anotación-touchbacks | 5-0-0 |
|---|
| Tiempo de posesión | 29:32 |
|---|
| Yardas brutas de pase | 221 |
|---|
| Yardas netas de carrera | 94 |
|---|
| Yardas netas de pase | 191 |
|---|
| Yardas netas por pase | 191 |
|---|
| Yardas netas totales | 285 |
|---|
| Yardas totales | 285 |
|---|
| Yardas totales de retorno (sin kickoffs) | 26 |
|---|
Pase
| Jugador | Cmp | Att | Yds | TD | INT | Rating | Sacks |
|---|
| Chad Pennington | 22 | 28 | 221 | 1 | 0 | 111.50 | 4 |
Carrera
| Jugador | Att | Yds | TD | Largo |
|---|
| Curtis Martin | 24 | 92 | 1 | 14 |
| LaMont Jordan | 1 | 2 | 0 | 2 |
Recepción
| Jugador | Rec | Obj | Yds | TD | Largo |
|---|
| Curtis Martin | 0 | 1 | 0 | 0 | |
| Santana Moss | 7 | 8 | 66 | 0 | 23 |
| Curtis Conway | 2 | 3 | 47 | 0 | 45 |
| Jerald Sowell | 5 | 7 | 43 | 0 | 13 |
| Kevin Lockett | 2 | 2 | 33 | 0 | 17 |
| Anthony Becht | 6 | 7 | 32 | 1 | 12 |
Defensiva
| Jugador | Tk | Solo | Asist | TFL | Sacks | Golpes QB | INT | Yds INT | FF | FR | Pases def. |
|---|
| Victor Hobson | 4 | 3 | 1 | 1 | 0 | 0 | 1 | 26 | 0 | 0 | 1 |
| Shaun Ellis | 5 | 1 | 4 | 0 | 1 | 2 | 0 | 0 | 0 | 0 | 0 |
| Jason Ferguson | 2 | 1 | 1 | 0 | 0.50 | 1 | 0 | 0 | 0 | 0 | 0 |
| Josh Evans | 1 | 0 | 1 | 0 | 0.50 | 1 | 0 | 0 | 0 | 0 | 0 |
| Doug Brien | 1 | 1 | 0 | 0 | 0 | 0 | 0 | 0 | 0 | 0 | 0 |
| Marvin Jones | 11 | 5 | 6 | 1 | 0 | 0 | 0 | 0 | 0 | 0 | 0 |
| Tyrone Carter | 7 | 5 | 2 | 0 | 0 | 0 | 0 | 0 | 0 | 0 | 1 |
| Ray Mickens | 5 | 5 | 0 | 0 | 0 | 0 | 0 | 0 | 0 | 0 | 0 |
| Sam Cowart | 4 | 2 | 2 | 0 | 0 | 0 | 0 | 0 | 0 | 0 | 1 |
| Sam Garnes | 4 | 2 | 2 | 0 | 0 | 0 | 0 | 0 | 0 | 0 | 1 |
| Bryan Thomas | 3 | 1 | 2 | 0 | 0 | 0 | 0 | 0 | 0 | 0 | 0 |
| Mo Lewis | 2 | 1 | 1 | 0 | 0 | 0 | 0 | 0 | 0 | 0 | 0 |
| Kenyatta Wright | 2 | 2 | 0 | 0 | 0 | | 0 | 0 | 0 | 0 | 0 |
| Aaron Beasley | 1 | 1 | 0 | 0 | 0 | 0 | 0 | 0 | 0 | 0 | 0 |
| Jason Glenn | 1 | 1 | 0 | 0 | 0 | 0 | 0 | 0 | 0 | 0 | 0 |
| Jamie Henderson | 1 | 0 | 1 | 0 | 0 | | | | | 0 | |
| Chester McGlockton | 1 | 1 | 0 | 0 | 0 | 0 | 0 | 0 | 0 | 0 | 0 |
| Derek Pagel | 1 | 1 | 0 | 0 | 0 | | 0 | 0 | 0 | 0 | 0 |
| James Reed | 1 | 0 | 1 | 0 | 0 | | 0 | 0 | 0 | 0 | 0 |
| Dewayne Robertson | 1 | 0 | 1 | 0 | 0 | | 0 | 0 | 0 | 0 | 0 |
| Quincy Stewart | 1 | 1 | 0 | 0 | 0 | | 0 | 0 | 0 | 0 | 0 |
| Matt Walters | 1 | 1 | 0 | 0 | 0 | | 0 | 0 | 0 | 0 | 0 |
Pateadores
| Jugador | FGm | FGa | Largo FG | XPm | XPa |
|---|
| Doug Brien | 2 | 2 | 36 | 1 | 1 |
Despejes (punts)
| Jugador | Punts | Yds | Prom | Largo | Dentro de 20 |
|---|
| Dan Stryzinski | 4 | 155 | 38.80 | 43 | 2 |
Retornos de patada (KO)
| Jugador | Retornos | Yds | Prom | Largo | TD |
|---|
| LaMont Jordan | 2 | 49 | 24.50 | 0 | 0 |
| Chris Baker | 1 | 4 | 4 | 0 | 0 |
| Kevin Swayne | 1 | 3 | 3 | 0 | 0 |
Miami Dolphins
Coach: Dave Wannstedt |
Puntos: 23 |
Record: 10-6
Estadísticas del equipo
| Balones sueltos y pérdidas | 1-0 |
|---|
| Balones sueltos-perdidos | 1-0 |
|---|
| Carreras-yardas-TD | 26-81-1 |
|---|
| Comp-Int-Yds-TD-INT | 21-29-328-1-1 |
|---|
| Conv. en cuarto down | 0-1 |
|---|
| Conv. en tercer down | 5-10 |
|---|
| Despejes: número y promedio | 0-0.0 |
|---|
| Eficacia en cuarto down | 0-1-0% |
|---|
| Eficacia en situación goal-to-go | 0-3-0% |
|---|
| Eficacia en tercer down | 5-10-50% |
|---|
| Eficacia en zona roja | 1-5-20% |
|---|
| FG y puntos extra bloqueados | 0-0 |
|---|
| Goles de campo anotados-intentados | 3-4 |
|---|
| Jugadas de carrera totales | 26 |
|---|
| Jugadas ofensivas totales (incluye sacks) | 57 |
|---|
| Pases intentados-completados-interceptados | 29-21-1 |
|---|
| Passing Made-Attempts | 0-0 |
|---|
| Patadas anotadas-intentadas | 2-2 |
|---|
| Penalizaciones-yardas | 5-30 |
|---|
| Penalizaciones: número y yardas | 5-30 |
|---|
| Placajes detrás de la línea: número y yardas | 2-3 |
|---|
| Por pase | 15 |
|---|
| Primeros downs | 20 |
|---|
| Primeros downs totales | 20 |
|---|
| Promedio neto de despeje | 0.0 |
|---|
| Promedio por carrera | 3.1 |
|---|
| Promedio por jugada de pase (incluye sacks) | 10.2 |
|---|
| Promedio por jugada ofensiva | 7.0 |
|---|
| Puntos extra anotados-intentados | 2-2 |
|---|
| Pérdidas de balón | 1 |
|---|
| Resultado final | 23 |
|---|
| Retornos de despeje: número y yardas | 0-0 |
|---|
| Retornos de intercepción: número y yardas | 0-0 |
|---|
| Retornos de kickoff: número y yardas | 5-120 |
|---|
| Sacks recibidos-yardas perdidas al pasar | 2-12 |
|---|
| Sacks-yardas perdidas | 2-12 |
|---|
| Saques de salida: total-en zona de anotación-touchbacks | 7-3-3 |
|---|
| Tiempo de posesión | 30:28 |
|---|
| Yardas brutas de pase | 328 |
|---|
| Yardas netas de carrera | 81 |
|---|
| Yardas netas de pase | 316 |
|---|
| Yardas netas por pase | 316 |
|---|
| Yardas netas totales | 397 |
|---|
| Yardas totales | 397 |
|---|
| Yardas totales de retorno (sin kickoffs) | 0 |
|---|
Pase
| Jugador | Cmp | Att | Yds | TD | INT | Rating | Sacks |
|---|
| Jay Fiedler | 21 | 29 | 328 | 1 | 1 | 106.70 | 2 |
Carrera
| Jugador | Att | Yds | TD | Largo |
|---|
| Jay Fiedler | 3 | 6 | 0 | 5 |
| Ricky Williams | 20 | 73 | 1 | 16 |
| Chris Chambers | 1 | 2 | 0 | 2 |
| Travis Minor | 1 | 0 | 0 | 0 |
| Matt Turk | 1 | 0 | 0 | 0 |
Recepción
| Jugador | Rec | Obj | Yds | TD | Largo |
|---|
| Ricky Williams | 4 | 5 | 72 | 0 | 59 |
| Chris Chambers | 9 | 10 | 153 | 1 | 24 |
| Randy McMichael | 3 | 7 | 40 | 0 | 27 |
| Derrius Thompson | 3 | 3 | 33 | 0 | 17 |
| Donald Lee | 2 | 2 | 30 | 0 | 20 |
| Rob Konrad | 0 | 1 | 0 | 0 | |
| Oronde Gadsden | 0 | 1 | 0 | 0 | |
Defensiva
| Jugador | Tk | Solo | Asist | TFL | Sacks | Golpes QB | INT | Yds INT | FF | FR | Pases def. |
|---|
| Adewale Ogunleye | 5 | 4 | 1 | 3 | 1 | 1 | 0 | 0 | 0 | 0 | 0 |
| Jeff Zgonina | 5 | 3 | 2 | 1 | 1 | 1 | 0 | 0 | 0 | 0 | 0 |
| Jason Taylor | 4 | 2 | 2 | 1 | 1 | 1 | 0 | 0 | 0 | 0 | 0 |
| David Bowens | 2 | 2 | 0 | 1 | 1 | 1 | 0 | 0 | 0 | 0 | 1 |
| Zach Thomas | 9 | 4 | 5 | 0 | 0 | 0 | 0 | 0 | 0 | 0 | 1 |
| Morlon Greenwood | 7 | 5 | 2 | 1 | 0 | 0 | 0 | 0 | 0 | 0 | 0 |
| Junior Seau | 7 | 2 | 5 | 0 | 0 | 0 | 0 | 0 | 0 | 0 | 0 |
| Brock Marion | 5 | 4 | 1 | 0 | 0 | 0 | 0 | 0 | 0 | 0 | 1 |
| Sammy Knight | 4 | 3 | 1 | 0 | 0 | 0 | 0 | 0 | 0 | 0 | 0 |
| Patrick Surtain | 4 | 2 | 2 | 0 | 0 | 0 | 0 | 0 | 0 | 0 | 0 |
| Terrell Buckley | 2 | 1 | 1 | 0 | 0 | 0 | 0 | 0 | 0 | 0 | 0 |
| Larry Chester | 2 | 0 | 2 | 0 | 0 | 0 | 0 | 0 | 0 | 0 | 0 |
| Arturo Freeman | 2 | 2 | 0 | 0 | 0 | 0 | 0 | 0 | 0 | 0 | 0 |
| Tommy Hendricks | 2 | 2 | 0 | 0 | 0 | 0 | 0 | 0 | 0 | 0 | 0 |
| Dario Romero | 2 | 2 | 0 | 0 | 0 | 0 | 0 | 0 | 0 | 0 | 0 |
| Sam Madison | 1 | 1 | 0 | 0 | 0 | | 0 | 0 | 0 | 0 | 0 |
| Travis Minor | 1 | 1 | 0 | | 0.0 | | 0 | 0 | | | |
Pateadores
| Jugador | FGm | FGa | Largo FG | XPm | XPa |
|---|
| Olindo Mare | 3 | 4 | 43 | 2 | 2 |
Retornos de patada (KO)
| Jugador | Retornos | Yds | Prom | Largo | TD |
|---|
| Travis Minor | 4 | 116 | 29 | 0 | 0 |
| Charlie Rogers | 1 | 4 | 4 | 0 | 0 |
Series ofensivas
Miami Dolphins
| # | Resultado | Yds netas | Jugadas | Cuarto | Posición | Inicio | Tiempo |
|---|
| 1 | Field Goal | 71 | 14 | 1 | MIA 25 | 15:00 | 7:27 |
| 2 | Field Goal | 61 | 6 | 1 | MIA 14 | 2:19 | 2:34 |
| 3 | Touchdown | 54 | 6 | 2 | MIA 46 | 12:42 | 2:48 |
| 4 | Touchdown | 48 | 5 | 2 | NYJ 48 | 6:08 | 3:13 |
| 5 | End of Half | -1 | 1 | 2 | MIA 32 | 0:14 | 0:14 |
| 6 | Missed FG | 36 | 9 | 3 | MIA 29 | 8:21 | 5:00 |
| 7 | Fumble, Safety | -10 | 4 | 3 | MIA 10 | 1:49 | 1:27 |
| 8 | Interception | 68 | 7 | 4 | MIA 31 | 8:58 | 4:52 |
| 9 | Field Goal | 45 | 9 | 4 | NYJ 49 | 2:56 | 2:53 |
New York Jets
| # | Resultado | Yds netas | Jugadas | Cuarto | Posición | Inicio | Tiempo |
|---|
| 1 | Punt | 26 | 7 | 1 | NYJ 20 | 7:33 | 5:14 |
| 2 | Punt | -9 | 3 | 2 | NYJ 20 | 14:45 | 2:03 |
| 3 | Touchdown | 80 | 7 | 2 | NYJ 20 | 9:54 | 3:46 |
| 4 | Field Goal | 62 | 13 | 2 | NYJ 20 | 2:55 | 2:41 |
| 5 | Field Goal | 60 | 12 | 3 | NYJ 36 | 15:00 | 6:39 |
| 6 | Punt | 8 | 3 | 3 | NYJ 44 | 3:21 | 1:32 |
| 7 | Touchdown | 57 | 11 | 3 | NYJ 43 | 0:22 | 6:24 |
| 8 | Punt | -10 | 3 | 4 | NYJ 25 | 4:06 | 1:10 |
| 9 | End of Game | 0 | 0 | 4 | | 0:03 | 0:03 |
Oficiales
- Referee: Gerry Austin
- Umpire: Roy Ellison
- Head Linesman: John Schleyer
- Line Judge: Carl Johnson
- Back Judge: Jim Howey
- Side Judge: Rick Patterson
- Field Judge: Scott Edwards